Data Visualisation & Infographics

Data Visualisation infographic for a medical app business, 2020. Adobe Illustrator and Photoshop
---

Infographic for BOP Consulting, 2022. Adobe InDesign, Illustrator & Photoshop
---
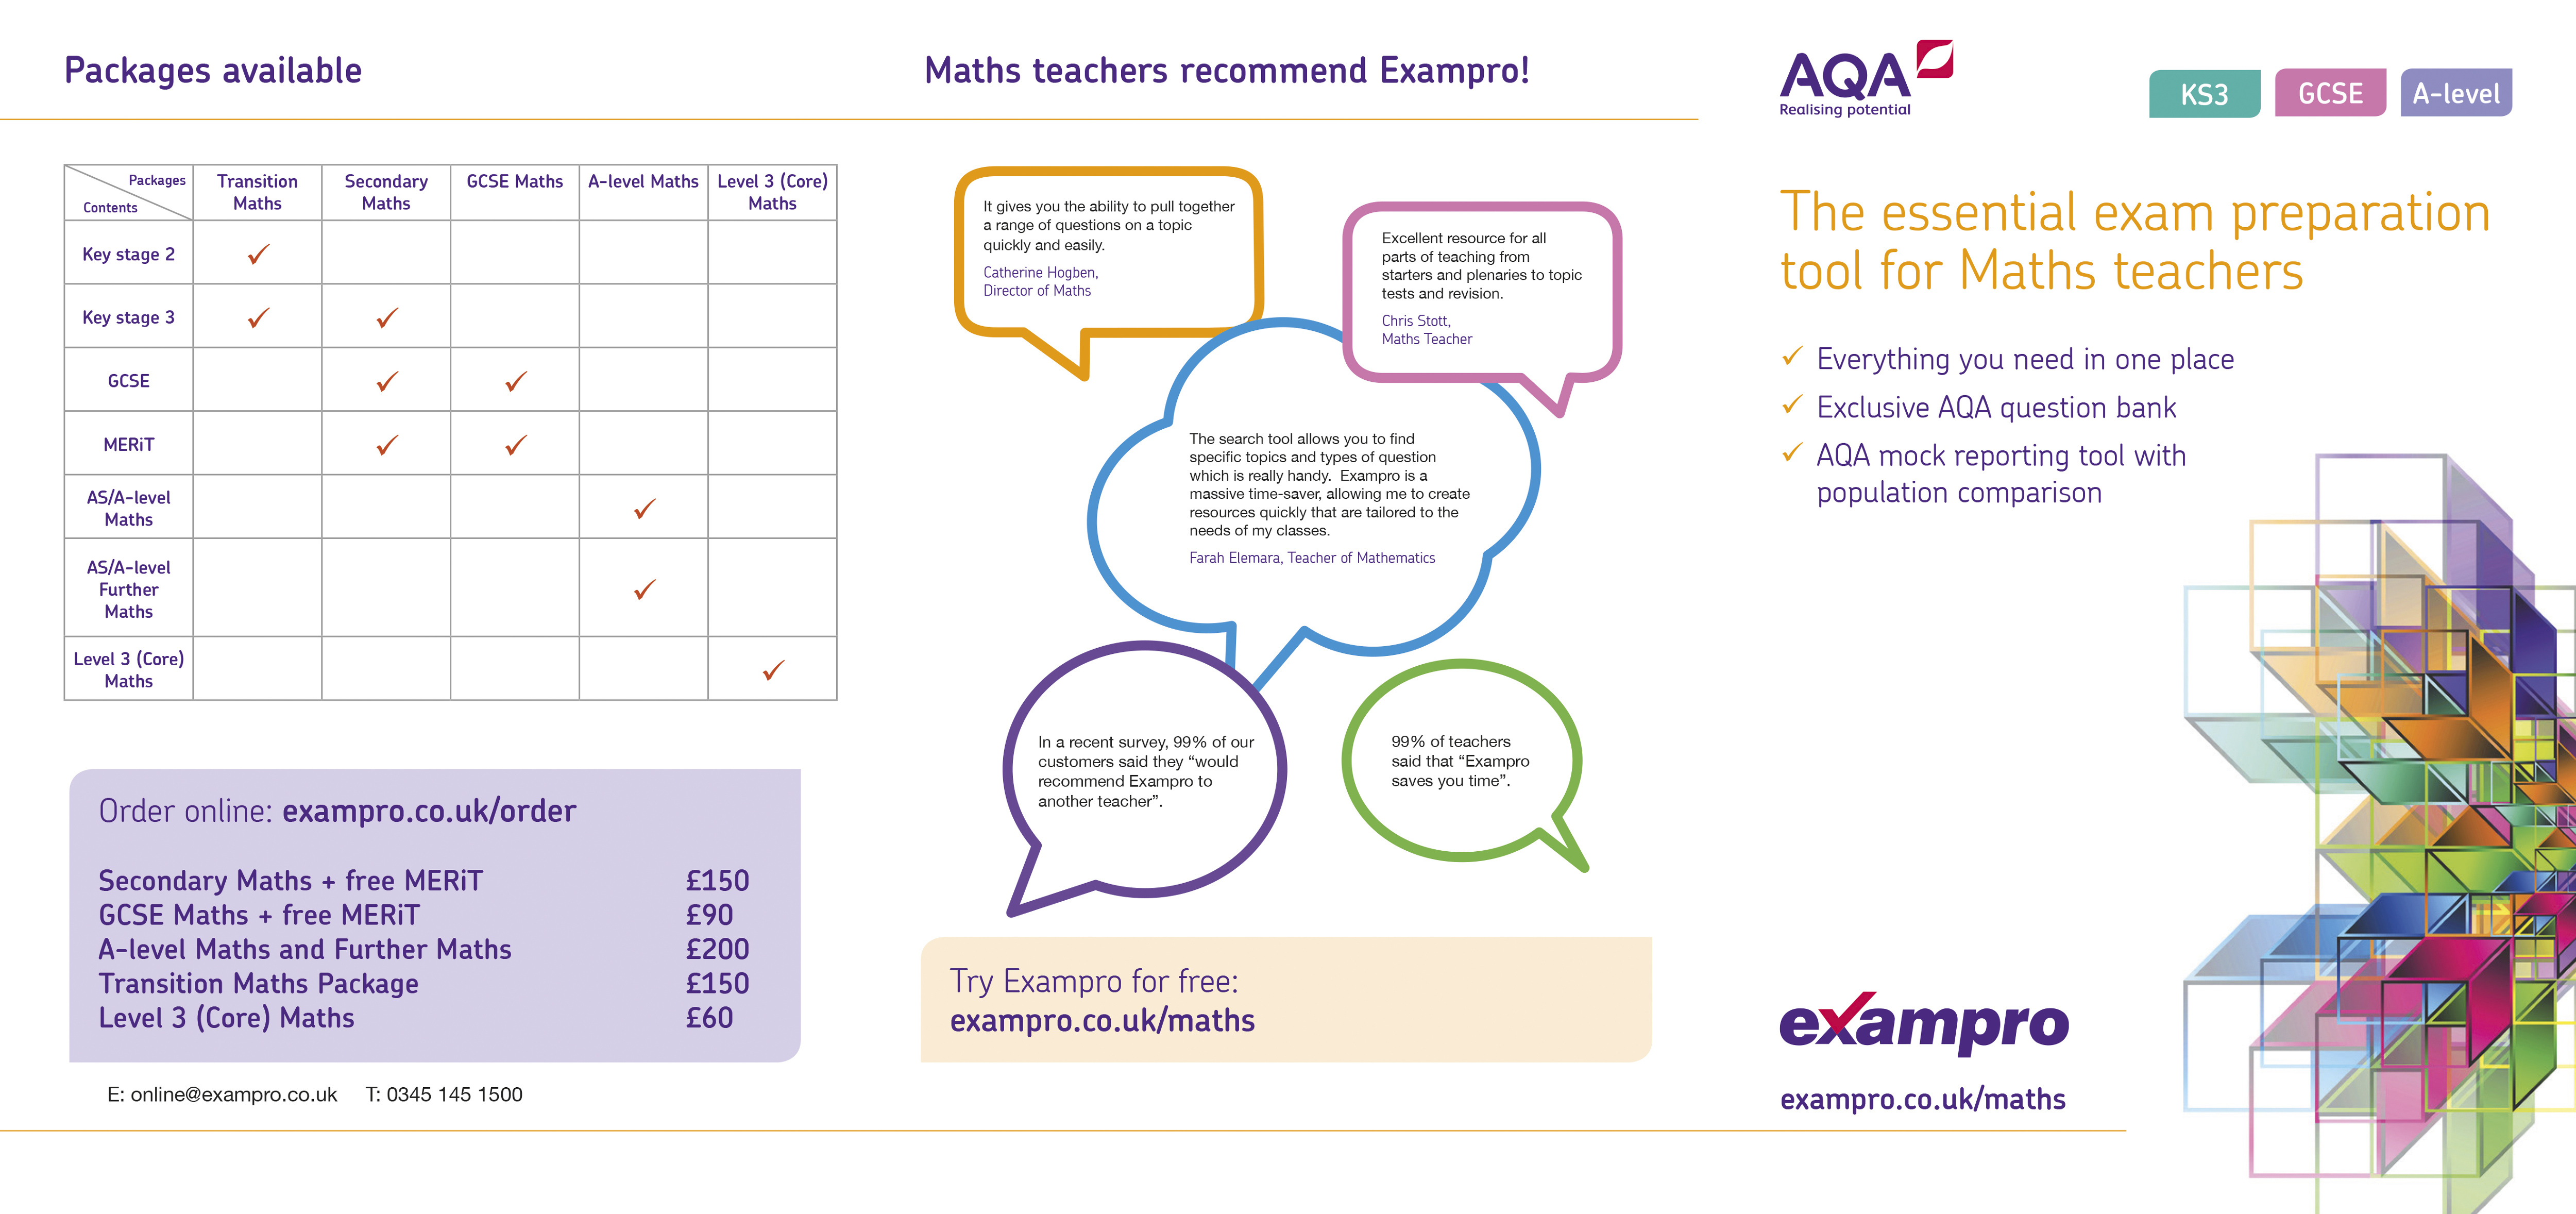

Exampro brochures (Doublestruck/AQA), 2019. Adobe InDesign, Illustrator & Photoshop
---
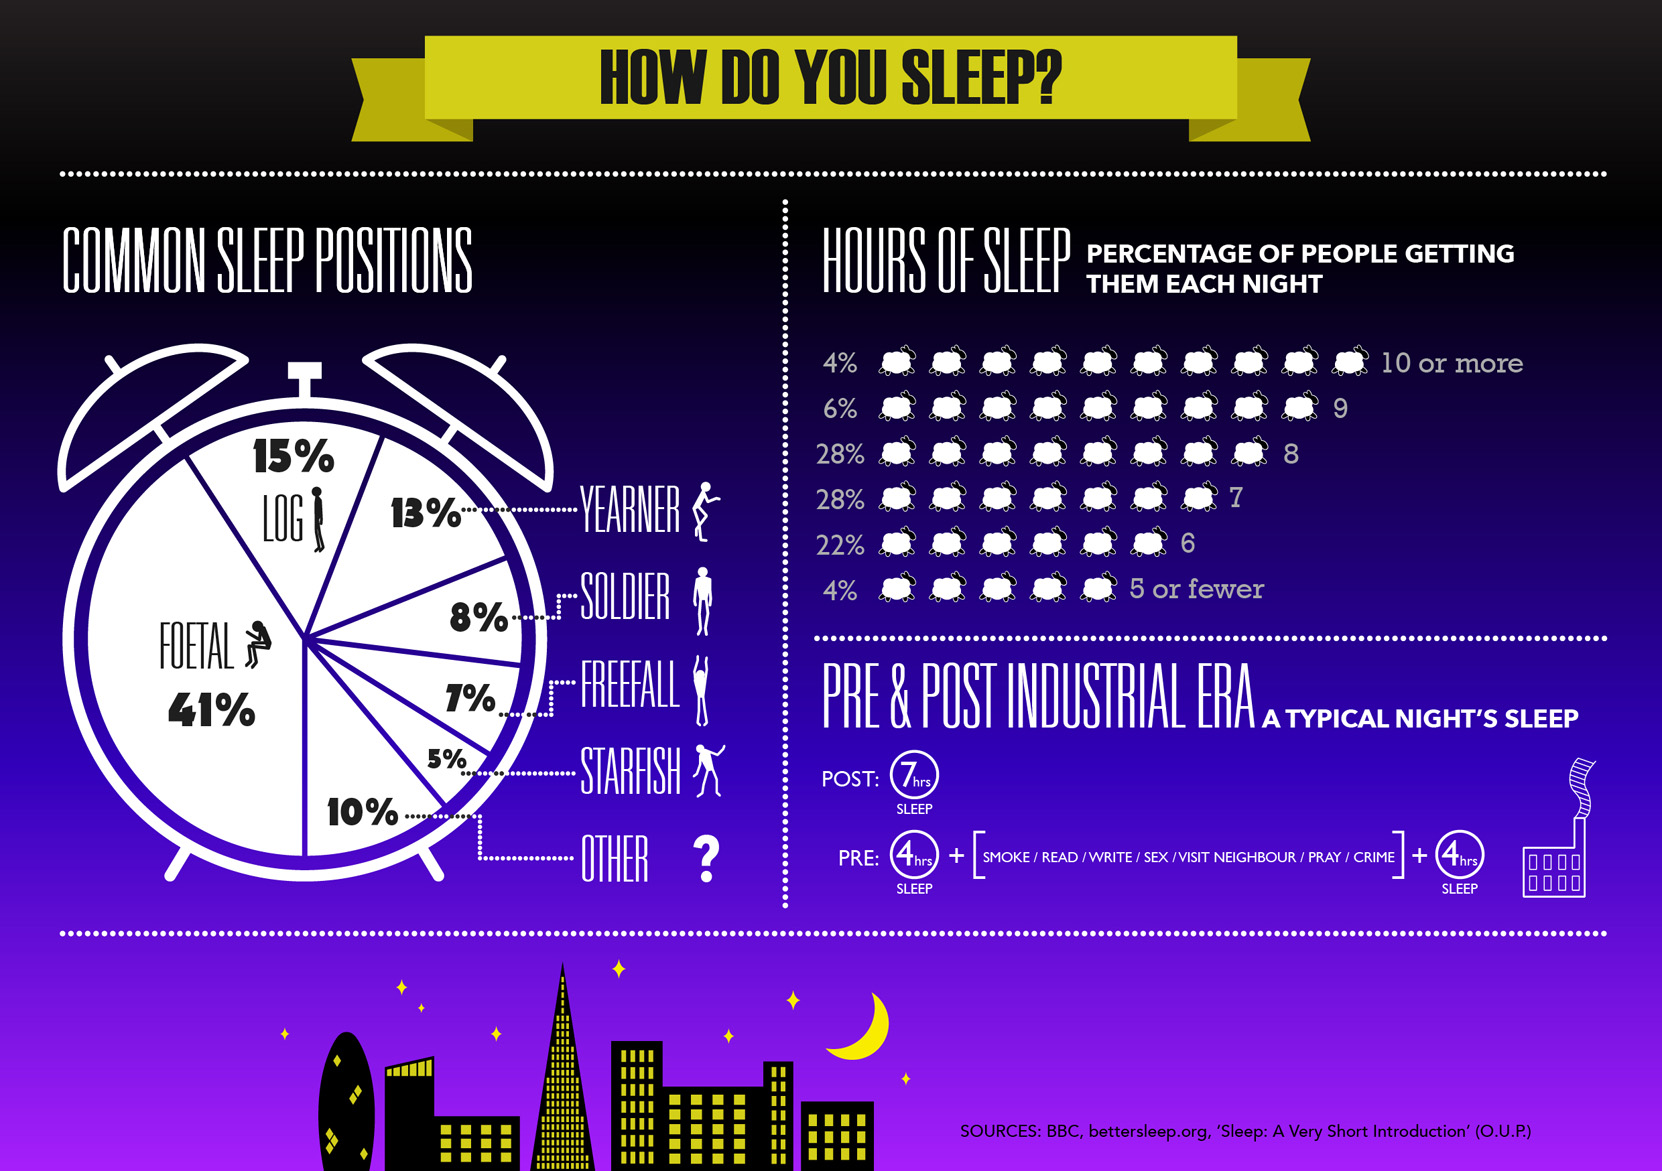
'How do you sleep?' infographic, 2013. Adobe Illustrator and Photoshop
---